Leaderboard

Popular Content
Showing content with the highest reputation on 04/07/2021 in all areas
-
Here's my attempt function TVWeek($d = null) { $dt = new DateTime($d); $y = $dt->format('Y'); $mon1 = new DateTime("$y-01-01"); // last week of year condition ++$y; $nextd1 = new DateTime("$y-01-01"); if ($dt->format('W') == $nextd1->format('W')) return 1; if ($mon1->format('w') != 1) { $mon1->modify('last monday'); } return intdiv( $mon1->diff($dt)->days, 7 ) + 1; } echo '<br>' . TVWeek(); // 1 echo '<br>' . date('W'); // 53 echo '<br>' . TVWeek('2020-06-01'); // 23 echo '<br>' . date('W', strtotime('2020-06-01')); // 23 echo '<br>' . TVWeek('2016-06-01'); // 23 echo '<br>' . date('W', strtotime('2016-06-01')); // 221 point
-
I tried Googling charts.js to have a look at their API documentation. What I found was nothing like the formats that you appear to be using. I did manage to get a chart produced using google.visualization api (if that helps) <?php $getdata = ' { "result": [ { "ID": 1, "Users": [ { "UserObject": { "UserName": "User1", "-": { "ID": 1 }, "0": "0" }, "User": "User1", "Amount": 10 }, { "UserObject": { "UserName": "User2", "-": { "ID": 1 }, "0": "0" }, "User": "User2", "Amount": 20 }, { "UserObject": { "UserName": "User3", "-": { "ID": 1 }, "0": "0" }, "User": "User3", "Amount": 15 } ], "Reached": false, "IsActive": true } ], "error": false, "version": 1 } '; $data = json_decode($getdata); $users = $data->result[0]->Users; $dataPoints = array( ['User', 'Amount'] ); foreach($users as $user): $dataPoints[] = array( $user->User, $user->Amount ); endforeach; $jdata = json_encode($dataPoints); ?> <!DOCTYPE HTML> <html> <head> <title>Test</title> <meta http-equiv="content-language" content="en"> <meta http-equiv="Content-Type" content="text/html; charset=utf-8"> <script type="text/javascript" src="https://www.gstatic.com/charts/loader.js"></script> <script type="text/javascript" src="https://ajax.googleapis.com/ajax/libs/jquery/1.5.0/jquery.min.js"></script> <script type='text/javascript'> $().ready(function() { google.charts.load('current', {'packages':['corechart']}); google.charts.setOnLoadCallback(drawChart); // Draw the chart and set the chart values function drawChart() { var dataArray = JSON.parse($("#chart-values").val()) var data = google.visualization.arrayToDataTable(dataArray); // Optional; add a title and set the width and height of the chart var options = { 'title':'User Amounts', 'width':550, 'height':400, 'slices': { 0: {'color':'#2ecc71' }, 1: {'color':'#3498db' }, 2: {'color':'#95a5a6' }, 3: {'color':'#9b59b6' }, 4: {'color':'#f1c40f' }, 5: {'color':'#e74c3c' }, 6: {'color':'#34495e' } } }; // Display the chart inside the <div> element with id="piechart" var chart = new google.visualization.PieChart(document.getElementById('myChart')); chart.draw(data, options); } }) </script> <style> .container { width: 80%; margin: 15px auto; } </style> </head> <body> <input type='hidden' id='chart-values' value='<?=$jdata?>'> <div class="container"> <h2>Pie Chart Demo</h2> <div id="myChart"></div> </div> </body> </html>
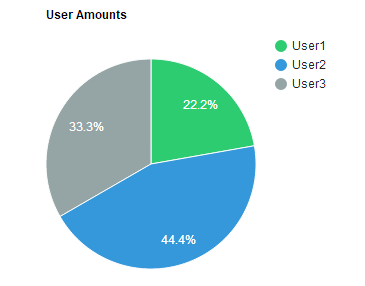 1 point
This leaderboard is set to New York/GMT-04:00