Leaderboard

Popular Content
Showing content with the highest reputation on 02/18/2021 in all areas
-
$this (programming pun intended) is the correct syntax, but produced a different error than the one you posted about the undefined variable. what was the error message in $this case? i'm going to guess that the database connection probably failed and there's no useful error handling in the code. while not the cause of the most immediate problem, your main code should be responsible for creating the database connection, then use dependency injection to supply that to any class that needs it. by making each class responsible for getting a specific database connection, your code is not general purpose. if the data source changes, to use an additional/different database type or using a remote api, you would need to go through and edit all the current code.1 point
-
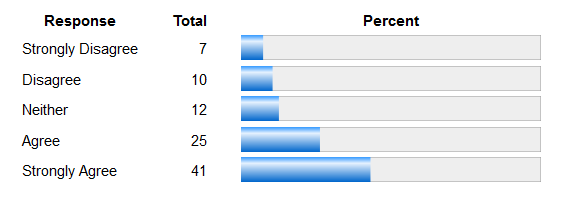
TIP: If you are creating home-grown charts, plotting the values is the easy bit. 95% of the coding effort will be in the drawing of chart area, plot area, axes, axis labels, scaling, titles etc. You can sidestep this with a simple table with horizontal bars. EG CODE EXAMPLE... <?php $values = [ 'Strongly Disagree' => 7, 'Disagree' => 10, 'Neither' => 12, 'Agree' => 25, 'Strongly Agree' => 41 ]; function valueChart(&$values) { $out = "<table class='chartTable'> <tr><th>Response</th> <th>Total</th> <th>Percent</th> </tr> "; $totalVal = array_sum($values); foreach ($values as $resp => $n) { $out .= "<tr><td>$resp</td> <td class='ra'>$n</td> <td>" . bar($n / $totalVal * 100) . "</td></tr>\n"; } $out .= "</table\n"; return $out; } function bar($val=0) { $a = '#3399ff'; $b = '#e6f2ff'; $c = '#0066cc'; $bg = '#eee'; $width = 300; $height = 25; $svg = <<<SVG <svg width='$width' height='$height' viewBox='0 0 $width $height'>"; <defs> <linearGradient id="bargrad" x1="0" y1="0" x2="0" y2="1"> <stop offset="0%" style="stop-color:$a"/> <stop offset="25%" style="stop-color:$b"/> <stop offset="100%" style="stop-color:$c"/> </linearGradient> </defs> <rect x='0' y='0' width='$width' height='$height' style='fill:$bg' stroke='#999'/> SVG; $w = $val/100 * $width; $svg .= "<rect x='0' y='0' width='$w' height='$height' style='fill:url(#bargrad)' />"; $svg .= "</svg>\n"; return $svg; } ?> <!DOCTYPE html> <html lang="en"> <meta http-equiv="Content-Type" content="text/html; charset=utf-8"> <title>Chart Example</title> <head> <style type='text/css'> .chartTable { font-family: arial, sans-serif; font-size: 11pt; } th { padding: 4px 16px ; } td { padding: 0 16px; } .ra { text-align: right; } </style> </head> <body> <?=valueChart($values)?> </body> </html> Hope this helps.
 1 point
This leaderboard is set to New York/GMT-04:00