Leaderboard


Popular Content
Showing content with the highest reputation on 12/20/2020 in all areas
-
There's no AJAX in anything you just posted. I'm also assuming that's an example because there's nothing there that JavaScript alone couldn't handle on its own. The PHP will parse the call to myphpfunction() on the server before the page gets sent to the browser - the JavaScript will be this: <script type="text/javascript"> alert("The sum is: 360"); </script> If that's all you need, that's fine. If you need to call myphpfunction() with different values based on a user selection and you don't want to reload the entire page, you're going to have to use JavaScript and AJAX.1 point
-
You don't need jQuery to run AJAX, you just need JavaScript. So, either go modern with fetch or use XMLHttpRequest (or ActiveXObject). If you want to make multiple AJAX calls from the same page, nothing's stopping you - pick a trigger and call a different PHP target for the request. If you want to get tricky, pass an 'action' parameter to your PHP and decide the action to run based on that - let resp = fetch(url, { method: 'get', body: JSON.stringify({ 'action': 'doSomething', 'data': ['data','more','etc'] }) }); function doSomething(){ switch($_GET['action']){ case 'doSomething': doSomething($_GET['data']); break; case 'doSomethingElse': doSomethingElse($_GET['data']); break; } } (not tested code, just a basic idea)1 point
-
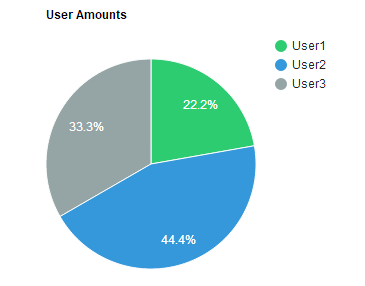
I tried Googling charts.js to have a look at their API documentation. What I found was nothing like the formats that you appear to be using. I did manage to get a chart produced using google.visualization api (if that helps) <?php $getdata = ' { "result": [ { "ID": 1, "Users": [ { "UserObject": { "UserName": "User1", "-": { "ID": 1 }, "0": "0" }, "User": "User1", "Amount": 10 }, { "UserObject": { "UserName": "User2", "-": { "ID": 1 }, "0": "0" }, "User": "User2", "Amount": 20 }, { "UserObject": { "UserName": "User3", "-": { "ID": 1 }, "0": "0" }, "User": "User3", "Amount": 15 } ], "Reached": false, "IsActive": true } ], "error": false, "version": 1 } '; $data = json_decode($getdata); $users = $data->result[0]->Users; $dataPoints = array( ['User', 'Amount'] ); foreach($users as $user): $dataPoints[] = array( $user->User, $user->Amount ); endforeach; $jdata = json_encode($dataPoints); ?> <!DOCTYPE HTML> <html> <head> <title>Test</title> <meta http-equiv="content-language" content="en"> <meta http-equiv="Content-Type" content="text/html; charset=utf-8"> <script type="text/javascript" src="https://www.gstatic.com/charts/loader.js"></script> <script type="text/javascript" src="https://ajax.googleapis.com/ajax/libs/jquery/1.5.0/jquery.min.js"></script> <script type='text/javascript'> $().ready(function() { google.charts.load('current', {'packages':['corechart']}); google.charts.setOnLoadCallback(drawChart); // Draw the chart and set the chart values function drawChart() { var dataArray = JSON.parse($("#chart-values").val()) var data = google.visualization.arrayToDataTable(dataArray); // Optional; add a title and set the width and height of the chart var options = { 'title':'User Amounts', 'width':550, 'height':400, 'slices': { 0: {'color':'#2ecc71' }, 1: {'color':'#3498db' }, 2: {'color':'#95a5a6' }, 3: {'color':'#9b59b6' }, 4: {'color':'#f1c40f' }, 5: {'color':'#e74c3c' }, 6: {'color':'#34495e' } } }; // Display the chart inside the <div> element with id="piechart" var chart = new google.visualization.PieChart(document.getElementById('myChart')); chart.draw(data, options); } }) </script> <style> .container { width: 80%; margin: 15px auto; } </style> </head> <body> <input type='hidden' id='chart-values' value='<?=$jdata?>'> <div class="container"> <h2>Pie Chart Demo</h2> <div id="myChart"></div> </div> </body> </html>
 1 point
This leaderboard is set to New York/GMT-04:00