-
Posts
24,612 -
Joined
-
Last visited
-
Days Won
834
Everything posted by Barand
-
So... Fix the errors. The messages tell you what's wrong and what they should be. Don't hijack other peoples threads.
-
Several things. Working backwards Trying to set "display_startup_errors" in your code is a fool's errand. If you have a startup error then the script won't run. If it won't run, how is it going to set that value? Set those values in you php.ini file Sql3 - Do not store derived values, like totals. These should be found by querying the stored values. Sql2 - all you want is the total value of the items, so get that directly in the query. No need to get all the items then iterate through them. Return the total from the function. $res = $pdo->prepare("SELECT SUM(amount_charged_each * quantity * chargable_units) FROM quote_items WHERE quote_id = :qId "); $res->execute([ $_GET['quote_id'] ]); return $res->fetchColumn(); // return the total
-

Getting Subject Position of a student from total scores using PHP
Barand replied to Ninotech's topic in PHP Coding Help
IMHO dense_rank() gives an exaggerated picture of performance. If you get 90% and the other 19 students in your class score 100%, your dense_ranking is 2nd, which is pure BS. If 19 people did better than you then you came 20th (which is what rank() would give. I have tried 2 or 3 times to install mysql version 8 with its window functions, but without success, so I had to do this the hard way. I sed two subqueries - one for the subject positions and the other for the class positions and joined them on REG. SELECT subj.reg , subj.subject , subj.total , subj.subject_rank+0 as subject_rank , clas.class_rank+0 as class_rank FROM ( SELECT reg , @prevrank := CASE WHEN subject <> @prevsub THEN 1 ELSE CASE WHEN total = @prevtot THEN @prevrank ELSE @prevrank + 1 END END as subject_rank , @prevsub := subject as subject , @prevtot := total as total FROM ( SELECT reg , subject , total FROM academic_result WHERE class= 'js1' AND term='1T' AND session='200/2001' ORDER BY subject, total DESC LIMIT 9223372036854775808 -- MariaDB bug workaround ) subj_sorted ) subj JOIN ( SELECT reg , @prevcrank := CASE WHEN tot = @prevctot THEN @prevcrank ELSE @prevcrank + 1 END as class_rank , @prevctot := tot as tot FROM ( SELECT reg , sum(total) as tot FROM academic_result WHERE class= 'js1' AND term='1T' AND session='200/2001' GROUP BY reg ORDER BY tot DESC LIMIT 9223372036854775808 ) cl_sorted ) clas USING (reg) JOIN ( SELECT @prevsub:=0, @prevtot:=0, @prevctot:=0, @prevrank := 0, @prevcrank := 0 ) init ORDER BY class_rank"; giving +-----+---------+-------+--------------+------------+ | reg | subject | total | subject_rank | class_rank | +-----+---------+-------+--------------+------------+ | 2 | bus101 | 90 | 1 | 1 | | 2 | chem101 | 85 | 1 | 1 | | 2 | csc101 | 90 | 1 | 1 | | 1 | bus101 | 70 | 2 | 2 | | 1 | chem101 | 75 | 2 | 2 | | 1 | csc101 | 85 | 2 | 2 | +-----+---------+-------+--------------+------------+- 1 reply
-
- 1
-

-
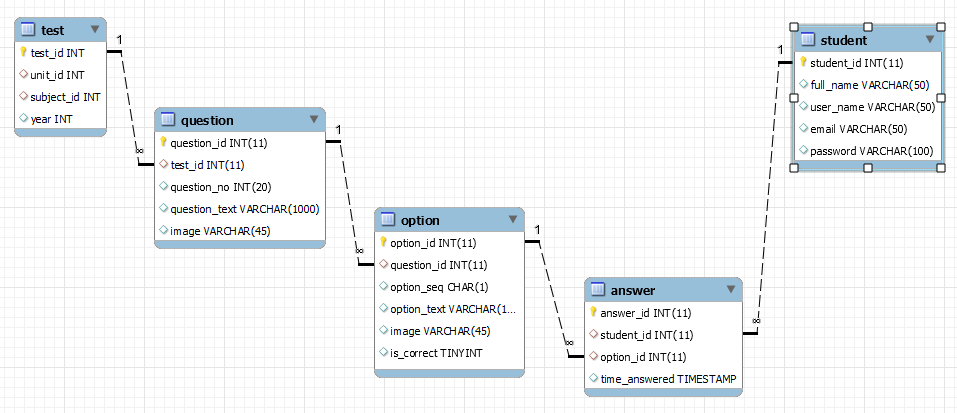
That's one half of the database. What you are calling "answers" I prefer to think of as "options". The "answers" (selected options) will be provided by those who take the quiz/test and stored. This gives another couple of entities, answer and student (assuming a student test scenario)
-
Shouldn't that be if(!isset($data[$item['sectionName']])){ ^ What is the relevance of the data you posted to the code?
-
The code you posted was using PHP variable names. ($days, $weeks) intdiv (x, y) == floor(x/y)
-
Correction: > 3 should be >= 3
-
':start_date' => trim($_POST['startDate'])!= '' ? $_POST['startDate'] : null;
-
Try $weeks = intdiv($days, 7) + ($days%7 > 3 ? 1 : 0);
-
It will if you try to write the same id twice - include id in the fields to be inserted if it should update the one already there or pass null if you want a new record inserted
-
You should be getting a mysql error - you have 7 placeholders but only passing 6 values in the execute. The way you have defined it you need to pass the $_POST['quotename'] twice. A better way is ... ON DUPLICATE KEY UPDATE name=VALUES(name) telling it to use the same value as in the VALUES clause. The you only need provide the name once. As for your problem, what has to be duplicated to throw a duplicate key error? Your id will be auto_incremented so that won't be duplicated.
-
Just don't use foreach() to iterate!
-
For decades I have lain awake at night pondering this major conundrum. Why do PDO::FETCH_BOTH and mysqli->fetch_array() exist? Surely one either wants an associative array or, occasionally, a numerically indexed array? Further, given their uselessness, why the hell are they the default? Can anyone enlighten me as to their raison d'être?
-
I am a little confused. 1 ) You echo three columns echo $cId; echo " ".$row['client_id']; echo " ".$row['sum(total_value)']; but your output shows only two... 2) both queries are using quotes table, so why not combine them into one and save yourself the foreach() loop?
-
It looks like your default fetch mode is PDO::FETCH_BOTH (default): returns an array indexed by both column name and 0-indexed column number as returned in your result set which gives you every value twice. Change your fetch default to PDO::FETCH_ASSOC in your connection options.
-
Does $sumOpenAndAcceptedValueByClient contain the results from another query?
-
Just alter the table to add the unique constraint. Run this query... ALTER TABLE `tablename` ADD UNIQUE INDEX `unq_user_date` (`user_id` ASC, `timestamp` ASC); Checking if it exists first is the worst way to do it.
-
If id in this instance is a foreign key, then you also have a poor column naming convention. Does your table have a unique constraint on this pair of columns? EG UNIQUE KEY (id, timestamp) If so, that will prevent a duplicate being inserted. INSERT IGNORE will prevent the attempt from throwing an error message.
-
id values should always be unique.
-
The example image with the grey background above used 8.2rem and 4rem for the two font sizes. The whole image was scaled was scaled at 100% inside 480px container width
-
I don't know, can't test under your conditions. I tried getting the geomanist font. It seems to be a con! The Altpo site gives you a "Free download" button then immediately asks you if you will be paying via Twitter or Facebook to continue. As this is a one-off, I exited.
-
Both are possible - SVG images are scalable without distortion. Relative positions and proportions are more important than actual sizes. Determine the width and height of the two text strings - use imagettfbbox() function to get dimensions. (Text1 is going to be about twice the fontsize of text2). Determine the size of the viewBox required to hold them (It helps to set a background color to the whole SVG if experimenting with its size so you can check the fit.) EG... Setting svg width to either 100% or 66% will give your width requirements above.
-
Your text baseline is 150px from the top of the drawing area but your font size is 193pt - that will crop the top off the text Should do, it's part of the page HTML DOM
-
At present, the font to be used is defined in the two text styles within the SVG. If you remove those two font-family attributes it will default to the font used by the parent (page body). If a different font is used you will have to adjust the font sizes and text positions, or adjust the "canvas"size (viewBox) Currently <svg width='100%' ... > fits the image to the width of the container. The whole image will scale proportionately as the container size changes so it alway fills the width.
-
Does this SVG version fit the bill? <div> <svg width='100%' viewBox='0 0 1400 200'> <defs> <style type='text/css'> .text1 { font-family: arial, sans-serif; font-size: 140pt; font-weight: 600; stroke: #DDD; fill: #FFF; } .text2 { font-family: arial, sans-serif; font-size: 70pt; font-weight: 600; fill: #4e1d8f; } .period { fill: #96bd0b; } </style> </defs> <text class='text1' x='50' y='150'> UK SUPPORT </text> <text class='text2' x='50' y='180'> Local & UK Website Design </text> <circle class='period' cx='1280' cy='170' r='10' /> </svg> </div>


